-
Follow us
-
0723.20.82.90 -
office@iagency.ro 

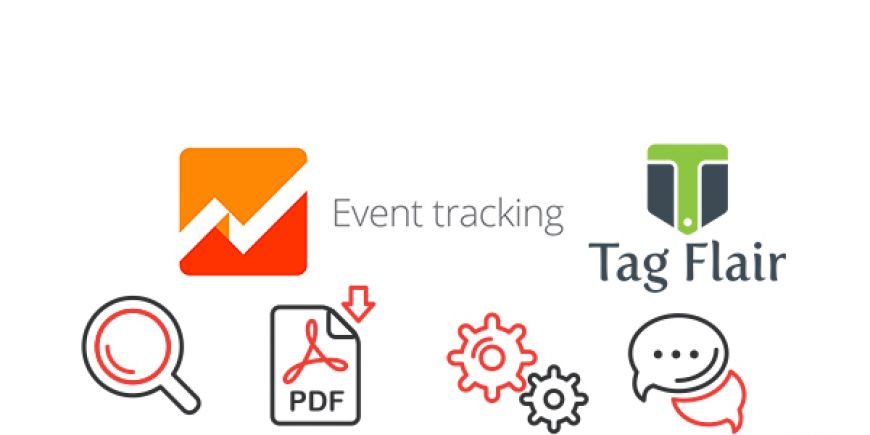
Events are interactions users have with the content, interactions that can be tracked independently in a Web page or in a loading screen. This includes a series of actions, such as watching a video, downloading a PDF file, Flash elements, incorporated AJAX elements, subscribing to a newsletter, clicks in a section of the page and the list goes on. Each event requires a customized tracking code that you must encode in your website, which is added to Google Analytics, where you can clearly see the actions of a visitor on a specific page.
How to create an event in order to reduce bounce rate
Any newly created event has several components and its values will be displayed in Google Analytics reports of behavior. Here they are:
1. Category – this represents the name given to the event in order to group objects that you want to follow. Generally and preferably would be to use the same category name multiple times, in the case of user interface elements. However, you can create separate categories of events, depending on the type of videos found on the site (movies or music videos), structured as follows:
In the example above, you can see the total number of events for the 3 categories existing in the reports. The value of the parameter called "Total number of events" will display the number of all events for all the categories implemented above. It is very important to plan your desired reports structure before you decide on the category names.
If you plan to use the same category name in multiple pages of the site, in order to reduce the bounce rate of the site, make sure that you use the correct name to make reference to each category.
Here`s an example that will make you understand the SF theory that I've described earlier: if you plan to set the name of the tracking video category as "Video" and then you forget you used it and you use the name "Videos", in your Google Analytics tracking events will appear two distinct following categories.
Moreover, if you decide to change the name of the category of a goal you seek, statistical data for the original category will not be reprocessed, and as a result, you'll have different values for the same item on the website, in two different categories in the Google Analytics reports interface.
2. Action – the name "Action" given to this reducing site bounce rate parameter is used to designate the type of event/interaction onsite you want to follow.
If in the category`s case it is ideal to have one representative name (just "Video", not "Videos"), here are some options:
How the action is set up is up to you, but it is important to remember two important characteristics of the way an action-event appears in the Google Analytics reports: - every action is listed independently from their parent categories. This is a useful way to segment the event data for your reports. - each unique event is determined by an unique action name. Otherwise, this can affect how unique events are calculated
3. Label (although optional, its presence is recommended) - provides additional information about the events that wish to implement or the ones that you follow. In Google Analytics there is a report that displays all the tags you create.
Like in the case of categories and actions, the name you provide for a label is totally up to you. Here`s two important features of how an event label is used in the reports:
- all labels appear independently from their parent categories and actions. This is an useful way to segment the event data for your reports.
- an unique event is partially determined by an unique label name. Duplicated label names can be used across categories and actions, but this can affect how unique events are calculated.
4. Value (optional) - it is interpreted as a number for a tracked page object or event. The report in Google Analytics adds the total values based on each event count and also determines the average value for the category. The best example is the one in which the action is the loading time of a video.
All these parameters are counted by default and, when following events, every tracked web page object is counted and associated with a given user session. In the Google Analytics reports, the total number of events is calculated as the total number of interactions with a tracked web page object. If an user clicks the same button on a video 5 times, the total number of events associated with the video is 5 and the number of unique events is 1.
The best practices of event implementation used to reduce bounce rate
The design model for implementing and following the events is extremely flexible, so that it can generate useful and structured reports. It is preferable to determine in advance all elements for which you want to track data.
Use a consistent and clear naming convention. By implementing the Event Tracking, every name you supply for categories, actions, and labels appears in the reporting interface. Moreover, a category/action pair is seen as an unique element in the report statistics, so firstly you should consider how you want your metrics to be calculated for all objects belonging to a similar category.
Types of events that can reduce bounce rate
1. Non-Interaction events
The term "Non-interaction" refers to the final (and optional) boolean parameter that can be passed to the method that sends the Event hit. This parameter determines how you the want bounce rate to be defined for the pages on your site that also include event tracking.
A very good example of this is represented by the sites that have videos on their homepage and how visitors interact with it. In this case, it is recommended that the interaction with the video to be included in the bounce rate calculation, so that sessions that include only the homepage with clicks on the video will not be calculated as bounce.
If you are interested to find out a more strict calculation of the bounce rate for your homepage, in which you want to know the percentage of sessions including only your homepage (regardless of clicks on the video), you need to exclude any interaction with the video from the bounce rate calculation.
Because a bounce is defined as a session containing only one interaction hit, when the value of the boolean parameter is set to "TRUE", the type of access to the event is not considered as interaction hit, even if the user triggers the event during the session. On the other hand, if you omit this action or you put it to "NULL", a session with a single page that contains the tracking events will not be counted as a bounce if the visitor also triggers the event during the same session.
2. Unique events
Unique events represent cases where one visitor interacts with the content in a single session, and the views can be seen separately from page views or screen. PDF downloads, clicks on pop-ups, video playbacks, Flash and AJAX interactions with elements incorporated etc., can be considered unique events.
These unique events are recorded in Google Analytics reports with the number 1 at every opportunity that fulfills a unique combination of Category / Action / Label / Value (optional) in an event.
3. Informative events
Informative events represent the significant changes of the site traffic. They are visible to those who are administrators or managers in Google Analytics reports for both the current view, and other views of Google Analytics reports.
Events can be informative overview, scheduled as daily, weekly or monthly events and can be set as follows:
Events / session limit
The first 10 visits of the events created on the site are sent to Google Analytics and followed immediately, and after that, their follow-up rate is limited to 1 event / second.
As the number of events in a session approaches the data collection limit, it is possible that these will no longer be traced. Therefore, if you create an event using the viewing of a video, we recommend the following:These are just some examples of events meant to reduce bounce rate. Whatever you choose, make sure you provide your visitors with quality information, clearly and concisely written, in order to maintain a pleasant experience on your site. To find out more information about what is bounce rate and how it affects your site's performance, you can read the following article.
Get the latest news and updates
By subscribing, you agree to our Privacy Policy
Leave the SEO optimization and online promotion of your business in our hands! With us, you’ll increase organic traffic -> brand awareness -> the number of customers -> sales -> profit! What do you say, shall we make you a personalized SEO offer?


